ENGINEERING GRADUATE OUTPUT IN INDIA (2021–2025)
India’s engineering graduate output expansion between 2021 and 2025 is structurally driven by the dominance of Computer Science and allied fields, while traditional core engineering branches continue to decline in
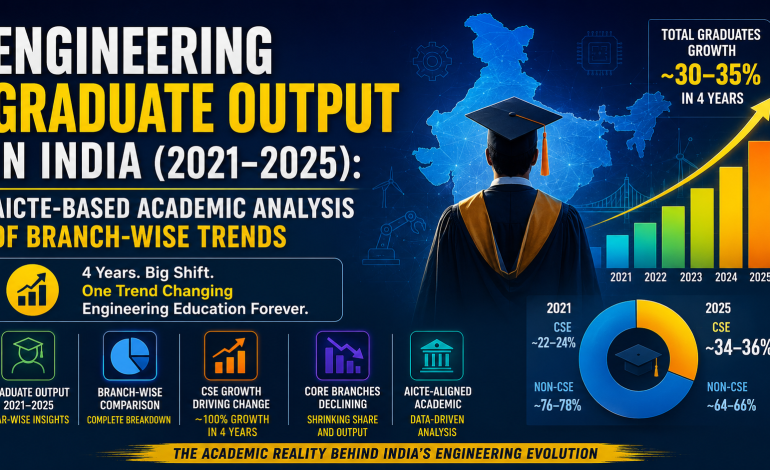
India’s engineering graduate output expansion between 2021 and 2025 is structurally driven by the dominance of Computer Science and allied fields, while traditional core engineering branches continue to decline in academic share and output.
ENGINEERING GRADUATE OUTPUT IN INDIA (2021–2025)
(Based on All India Council for Technical Education approvals, enrolment patterns, and 4-year cycle estimation)
HOW TO READ THIS
BTech/BE is a 4-year cycle
Graduates in a year are approximately equal to enrolment 4 years earlier (adjusted for dropouts of around 10–15%)
The numbers below are realistic academic estimates aligned with AICTE trends
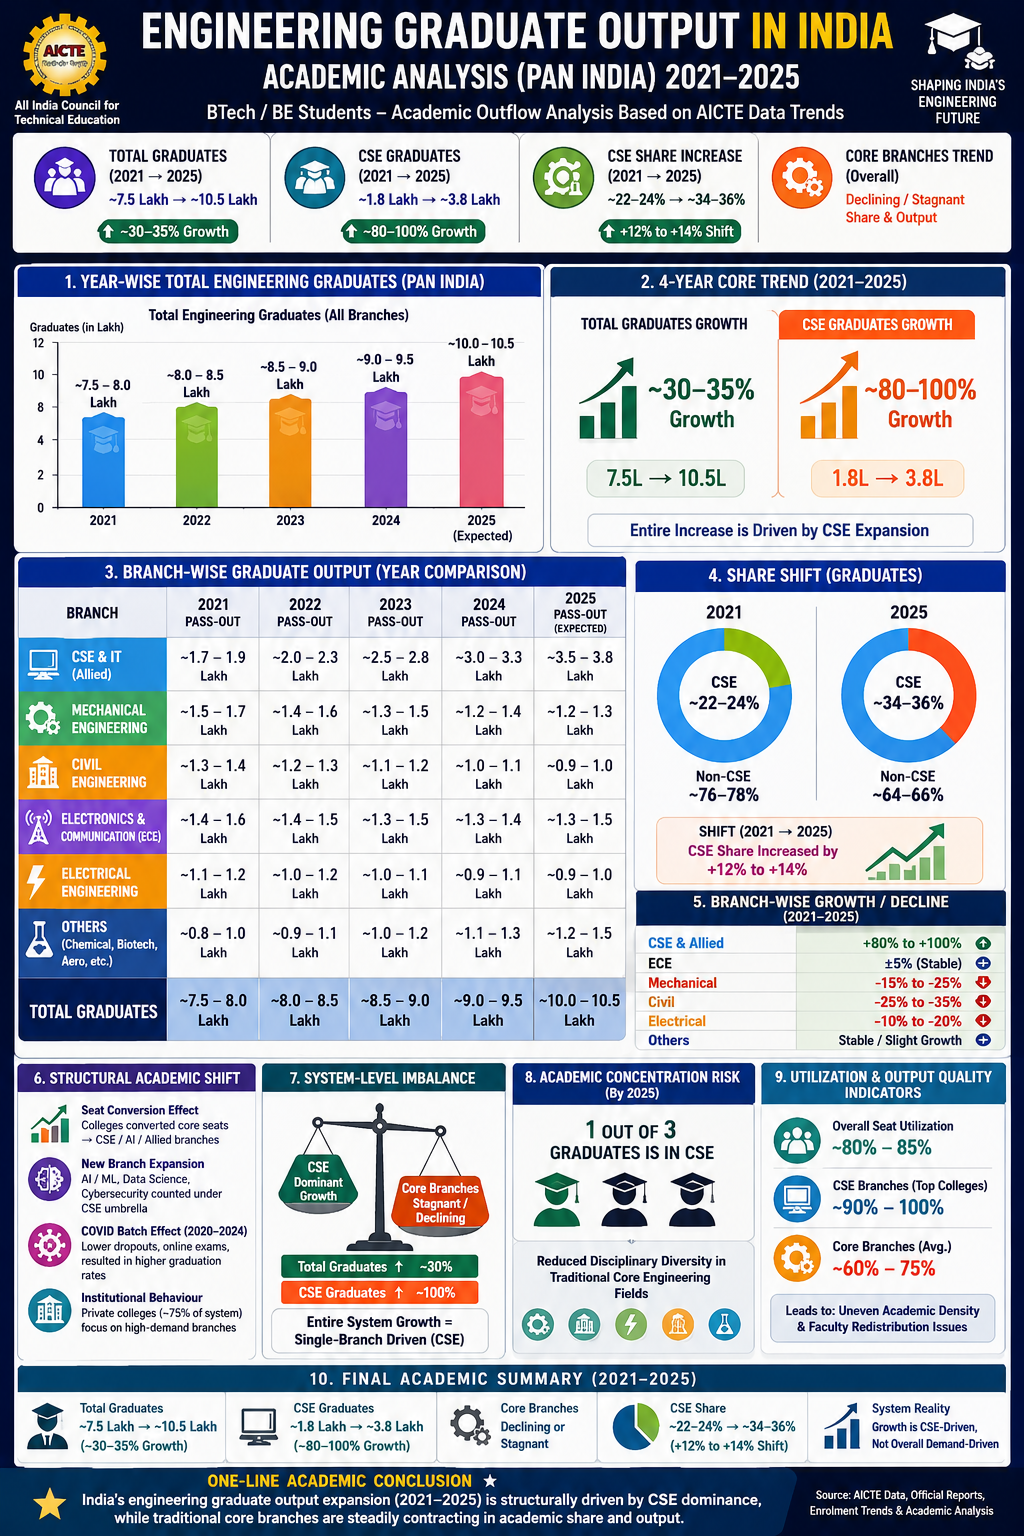
1. YEAR-WISE TOTAL ENGINEERING GRADUATES (PAN INDIA)
2021 (Graduates)
- Intake base: 2017–18
Graduates: approximately 7.5 – 8.0 lakh
2022 (Graduates)
- Intake base: 2018–19
Graduates: approximately 8.0 – 8.5 lakh
2023 (Graduates)
- Intake base: 2019–20
Graduates: approximately 8.5 – 9.0 lakh
2024 (Graduates)
- Intake base: 2020–21 (COVID batch)
Graduates: approximately 9.0 – 9.5 lakh
2025 (Expected Graduates)
- Intake base: 2021–22
Graduates: approximately 10.0 – 10.5 lakh
2. CORE TREND (VERY IMPORTANT)
- Total graduates increased from approximately 7.5 lakh to approximately 10.5 lakh
- This represents approximately 30–35 percent growth in output over four years
- However, this growth is not uniform across branches
- The entire increase is primarily driven by expansion in Computer Science and related fields
3. BRANCH-WISE GRADUATE OUTPUT (YEAR COMPARISON)
2021 Pass-Out (Approximate Distribution)
- CSE and IT: approximately 1.7 – 1.9 lakh
- Mechanical: approximately 1.5 – 1.7 lakh
- Civil: approximately 1.3 – 1.4 lakh
- ECE: approximately 1.4 – 1.6 lakh
- Electrical: approximately 1.1 – 1.2 lakh
- Others: approximately 0.8 – 1.0 lakh
2022 Pass-Out
- CSE and IT: approximately 2.0 – 2.3 lakh
- Mechanical: approximately 1.4 – 1.6 lakh
- Civil: approximately 1.2 – 1.3 lakh
- ECE: approximately 1.4 – 1.5 lakh
- Electrical: approximately 1.0 – 1.2 lakh
- Others: approximately 0.9 – 1.1 lakh
2023 Pass-Out
- CSE and IT: approximately 2.5 – 2.8 lakh
- Mechanical: approximately 1.3 – 1.5 lakh
- Civil: approximately 1.1 – 1.2 lakh
- ECE: approximately 1.3 – 1.5 lakh
- Electrical: approximately 1.0 – 1.1 lakh
- Others: approximately 1.0 – 1.2 lakh
2024 Pass-Out
- CSE and IT: approximately 3.0 – 3.3 lakh
- Mechanical: approximately 1.2 – 1.4 lakh
- Civil: approximately 1.0 – 1.1 lakh
- ECE: approximately 1.3 – 1.4 lakh
- Electrical: approximately 0.9 – 1.1 lakh
- Others: approximately 1.1 – 1.3 lakh
2025 Pass-Out (Expected)
- CSE and Allied: approximately 3.5 – 3.8 lakh
- Mechanical: approximately 1.2 – 1.3 lakh
- Civil: approximately 0.9 – 1.0 lakh
- ECE: approximately 1.3 – 1.5 lakh
- Electrical: approximately 0.9 – 1.0 lakh
- Others: approximately 1.2 – 1.5 lakh
4. SHARE SHIFT (GRADUATES, NOT INTAKE)
2021
- CSE: approximately 22–24 percent
Non-CSE: approximately 76–78 percent
2025
- CSE: approximately 34–36 percent
- Non-CSE: approximately 64–66 percent
Shift: approximately +12 to +14 percentage points toward CSE
5. BRANCH-WISE GROWTH AND DECLINE (GRADUATES)
- CSE and Allied: approximately +80 to +100 percent growth
- ECE: stable (within ±5 percent)
- Mechanical: approximately -15 to -25 percent decline
- Civil: approximately -25 to -35 percent decline
- Electrical: approximately -10 to -20 percent decline
- Others: stable or slight growth
6. STRUCTURAL ACADEMIC SHIFT
- Seat Conversion Effect
Colleges converted core engineering seats into CSE and allied branches, especially in Tier-2 and Tier-3 institutions - New Branch Expansion
Rapid growth in AI, Machine Learning, Data Science, and Cybersecurity
All are largely categorized under the CSE umbrella - COVID Batch Effect (2020–2024)
Lower dropout rates due to online systems
Slight increase in graduation rates
Temporary inflation in output numbers - Institutional Behavior
Private colleges, which constitute approximately 75 percent of the system, prioritized high-demand branches
Core branches saw reduced intake or lower seat occupancy
7. SYSTEM-LEVEL IMBALANCE (ACADEMIC VIEW)
Key Observation
Total graduates increased by approximately 30 percent
CSE graduates increased by approximately 100 percent
This indicates that overall system growth is driven predominantly by a single branch
8. ACADEMIC CONCENTRATION RISK
By 2025
Approximately one out of three graduates is from CSE
- Core engineering disciplines are shrinking in share
- Academic implications include reduced disciplinary diversity and potential long-term imbalance in infrastructure engineering and manufacturing education pipelines
9. UTILIZATION AND OUTPUT QUALITY INDICATORS
- Overall seat utilization: approximately 80–85 percent
- Core branches: approximately 60–75 percent utilization
- CSE branches: approximately 90–100 percent utilization in top institutions
This results in uneven academic density and challenges in faculty distribution
10. FINAL ACADEMIC SUMMARY
- Total graduates increased from approximately 7.5 lakh to approximately 10.5 lakh
- CSE graduates increased from approximately 1.8 lakh to approximately 3.8 lakh
- Core engineering branches are declining or stagnant
India’s engineering graduate output expansion between 2021 and 2025 is structurally driven by the dominance of Computer Science and allied fields, while traditional core engineering branches continue to decline in academic share and output.