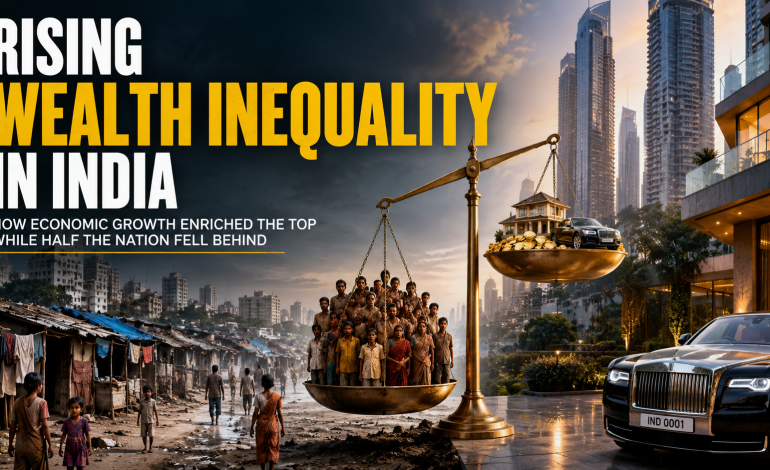
RISING WEALTH INEQUALITY IN INDIA
RISING WEALTH INEQUALITY IN INDIA Concentration of Wealth and Its Social Consequences In December 2025, the World Inequality Report 2026 dropped a bombshell on India’s self-image as a rising economic
RISING WEALTH INEQUALITY IN INDIA
Concentration of Wealth and Its Social Consequences
In December 2025, the World Inequality Report 2026 dropped a bombshell on India’s self-image as a rising economic powerhouse. The numbers were stark and unsparing: the top 10 percent of Indians now capture nearly 58 percent of the national income, while the bottom 50 percent survive on just 15 percent. Even more staggering, the top 1 percent alone holds 40 percent of India’s total wealth, making the country one of the most unequal in the world .
These figures were not abstract statistics from a distant think tank. They were the product of a decade of India’s much-celebrated economic boom—a period when stock markets soared, billionaires multiplied, and India positioned itself as the world’s fastest-growing major economy. Yet the report’s foreword, written by economists Jayati Ghosh and Joseph Stiglitz, carried a sobering message: India’s economic growth had failed to lift the bottom 50 percent .
The numbers told a brutal story of divergence. The average Indian earns about €6,200 (PPP) per year. But this average masked chasmic divides. A person in the top 1 percent earns €140,649 on average—over 22 times more than the national average. A person in the bottom 50 percent barely reaches €940 .
On the wealth front, the picture was even more skewed. While the average Indian holds assets worth around €28,000, the bottom half of the population controls just 6 percent of India’s wealth . The top 1 percent’s share in wealth had increased from 36.5 percent in 2019 to 40.1 percent from 2022 onwards, while the bottom 50 percent’s share declined from 6.8 percent to 6.4 percent during the same period . Even more dramatically, the combined wealth of India’s top five billionaire families increased by about 400 percent between 2019 and 2025—Mukesh Ambani’s wealth grew by 153 percent, while Gautam Adani’s wealth skyrocketed by 625 percent .
Against this backdrop of soaring wealth at the top and stagnation at the bottom, the Union Budget 2026-27 was unveiled. It allocated over ₹12.2 lakh crore to capital expenditure—infrastructure, industrial corridors, manufacturing incentives. Critics argued that while macroeconomic indicators glittered, the Budget had little for the poor, the marginalized, and the millions trapped in low-paying, informal work .
This article examines the dynamics of rising wealth inequality in India, the mechanisms driving wealth concentration, and the social, economic, and democratic consequences of a growth model that has left half the country behind.
WHAT – Wealth inequality refers to the unequal distribution of assets—property, stocks, bank deposits, jewelry, and other forms of wealth—across a population. Unlike income inequality, which measures flows of money over a period, wealth inequality measures the stock of accumulated assets at a point in time, and it is typically much more concentrated. In India, wealth inequality is among the highest in the world, with the top 10 percent holding approximately 65 percent of total wealth and the top 1 percent holding about 40 percent .
WHO – The key actors in India’s inequality story include the top 1 percent of earners and wealth-holders (approximately 14 million individuals), the bottom 50 percent of the population (approximately 700 million individuals), industrialist families such as the Ambanis and Adanis whose wealth has grown exponentially, political parties (the BJP government which defends its economic record, and the Congress which accuses it of crony capitalism), economists and researchers at institutions like the World Inequality Lab (Thomas Piketty, Lucas Chancel, Jayati Ghosh, Joseph Stiglitz), and international bodies that track global inequality trends.
WHEN – The current phase of extreme wealth concentration has been building since the economic reforms of the 1990s, but has accelerated dramatically in the period from 2014 to 2026. The World Inequality Report 2026 was released in December 2025, analyzing data up to 2025. The Wealth Tracker India 2026 examined patterns from 2019 to 2025, documenting a sharp increase in top 1 percent wealth share from 36.5% in 2019 to 40.1% from 2022 onwards .
WHERE – Across India, though wealth concentration is most visible in major metropolitan centers—Mumbai (home to the country’s financial markets and billionaire class), Delhi-NCR, Bengaluru (the IT hub), Ahmedabad (the Adani stronghold), and Hyderabad. However, the consequences of inequality are felt nationwide, from rural villages where farmers struggle with debt to urban slums where informal workers face rising living costs.
WHY – Multiple structural factors drive wealth concentration: the nature of India’s post-1990s growth model which has favored capital-intensive sectors over labor-intensive manufacturing; crony capitalism and the proximity between political power and industrial houses; regressive tax structures that do not adequately tax wealth; the erosion of social safety nets and public services; feminization of low-paid informal work with female labor participation stuck at 15.7% for a decade ; and a fiscal policy that prioritizes capital expenditure over redistributive welfare .
HOW – Through mechanisms such as stock market appreciation benefiting asset-owning classes; privatization of public assets that transfers wealth from the state to corporate entities; weak enforcement of competition laws allowing dominant firms to capture markets; tax policies that favor capital gains over labor income; and the decline of labor unions and collective bargaining power.
SECTION 1: THE NUMBERS — DECODING INDIA’S INEQUALITY CRISIS
The World Inequality Report 2026, edited by economists Lucas Chancel, Ricardo Gómez-Carrera, Rowaida Moshrif, and Thomas Piketty, and prefaced by Jayati Ghosh and Joseph Stiglitz, provides the most comprehensive picture of India’s inequality landscape .
Income Inequality: The 58-15 Divide
The headline finding is stark: the top 10 percent of earners in India capture 58 percent of the national income, while the bottom 50 percent receive only 15 percent . This gap has shown “little improvement” over the past decade. For context, the top 10 percent’s share in 2021, according to the previous World Inequality Report 2022, was 57 percent—meaning the share of the top decile has actually increased .
Even more telling is what happened to the income gap between the richest 10 percent and poorest 50 percent between 2014 and 2024: it “has not budged” . This stagnation signals deep, systemic barriers that prevent ordinary Indians from moving up.
The absolute numbers are devastating. The average annual income per capita in India is about €6,200 (PPP). But:
-
The top 1 percent earns on average €140,649 — over 22 times the national average
-
The bottom 50 percent earns barely €940
Wealth Inequality: The 40 Percent Threshold
Wealth inequality in India is even more extreme than income inequality. The richest 10 percent hold around 65 percent of total wealth, while the top 1 percent alone holds about 40 percent of India’s total wealth .
The trajectory is worsening. According to the Wealth Tracker India 2026, the share of the top 1 percent in wealth increased from 36.5 percent in 2019 to 40.1 percent from 2022 onwards. During the same period, the share of the bottom 50 percent declined from 6.8 percent to 6.4 percent .
The average Indian holds assets worth around €28,000 (PPP) . But this average conceals the chasm: a person in the bottom 50 percent owns about 6,500 euros, while someone in the top 10 percent holds around 1 million euros .
The Billionaire Boom
The concentration at the very top is perhaps most visible in the growth of billionaire wealth. The combined wealth of India’s top five billionaire families increased by about 400 percent between 2019 and 2025 .
-
Mukesh Ambani’s wealth grew by 153 percent
-
Gautam Adani’s wealth increased by 625 percent
The M3M Hurun India Rich List 2025 reported that the cumulative wealth of India’s richest 1,687 individuals is estimated at ₹167 lakh crore—nearly half of the nation’s GDP. India has been creating a billionaire every week for the past two years .
The Global Context
India’s inequality is not merely a local phenomenon—it is among the worst in the world. The World Inequality Report notes that globally, wealth has reached historic highs but remains very unevenly distributed. The top 0.001 percent (fewer than 60,000 multi-millionaires) owns three times more wealth than the entire bottom half of humanity .
The report provides a geographic breakdown of global income distribution. In 1980, India had a larger part of its population in the global middle 40 percent. But today, almost all of India’s population is concentrated in the global bottom 50 percent . India has lost relative ground even as China has moved upward, with much of its population having entered the middle 40 percent.
SECTION 2: THE GROWTH-INEQUALITY PARADOX — WHY THE BOOM LEFT THE BOTTOM BEHIND
India’s GDP growth has been among the highest in the world. Yet this macroeconomic expansion has “not translated into equitable welfare” . The World Inequality Report makes the point bluntly: despite a decade of booming stock markets, expanding industries, and record-breaking billionaires, the income gap between the richest 10 percent and the poorest 50 percent “has not budged from 2014 to 2024” .
The Capital-Intensive Growth Model
The academic paper “Development for Whom?” argues that India’s contemporary development trajectory has “disproportionately benefited a narrow alliance of corporate conglomerates, political elites, bureaucratic institutions, and state-supported contractors.” Despite sustained GDP expansion, “nearly a billion Indians continue to face poverty, inflation, unemployment, and inadequate access to essential services” .
The paper contrasts India’s market-led, privatization-heavy development model with China’s state-directed, manufacturing-oriented strategy, which successfully eradicated extreme poverty and established the country as the world’s leading industrial hub. The key difference: India’s growth has been capital-intensive, creating fewer jobs per unit of growth, while China’s growth was labor-intensive, absorbing millions into formal manufacturing employment .
The Budget 2026 Critique
The Union Budget 2026-27, with its allocation of over ₹12.2 lakh crore to capital expenditure, became a flashpoint in the inequality debate. Critics argued that the Budget “continues to advance a growth-led fiscal strategy” with “large increases in infrastructure spending and manufacturing incentives” that “primarily benefit capital owners and established business groups” .
The combined subsidy bill is expected to decrease by approximately 28 percent from its previous apex, as pandemic-era measures—including free foodgrains under Pradhan Mantri Garib Kalyan Anna Yojana—are phased out. These reductions, the critique argues, “occur during a period in which food inflation remains high and real incomes for low-income households have stagnated” .
In contrast, fiscal relief measures—including increased income-tax exemption thresholds—”primarily benefit medium- to high-income earners and capital-intensive sectors.” The budget, the analysis concludes, “seems to reinforce inequalities rather than mitigating them in the absence of more social protection, income support, or transfer payments for impoverished households” .
Structural Barriers to Mobility
Economists cited in the World Inequality Report say the stagnation in income shares signals “deep, systemic barriers that prevent ordinary Indians from moving up” . These barriers include:
-
Education and health deficits: Public investment in education and health has been “steadily declining,” limiting the human capital development essential for upward mobility
-
Informal sector dominance: Most Indians work in low-paying informal jobs without social security, limiting their ability to accumulate assets
-
Caste and social exclusion: Historical disadvantages continue to shape access to opportunity, with SC/ST communities disproportionately represented in the bottom half
-
Regional disparities: Some states and regions have grown much faster than others, creating geographic inequality traps
SECTION 3: THE MECHANISMS OF WEALTH CONCENTRATION
How does wealth become so concentrated in so few hands? Several mechanisms are at work.
Stock Market Appreciation and Asset Ownership
One of the primary drivers of wealth concentration in recent years has been the extraordinary run of Indian stock markets. Those who own assets—stocks, real estate, business equity—have seen their wealth multiply. Those who own nothing have been left behind.
The World Inequality Report’s income share data, showing no improvement in the bottom 50 percent’s position despite a decade of market boom, suggests that the benefits of asset appreciation have flowed almost entirely to the top. The Wealth Tracker India 2026’s finding that the top 1 percent’s wealth share increased from 36.5% to 40.1% between 2019 and 2022 coincides with a period of strong equity market performance .
Crony Capitalism and Elite Capture
The Congress party has alleged that the concentration of wealth is “driven by the Modi government’s economic policies” and is “not merely an economic issue but a direct attack on the very soul of democracy” . Congress general secretary Jairam Ramesh claimed that “a few industrialists are becoming richer and richer due to the power nexus” and that “the Prime Minister’s policies are focused solely on the benefits of his industrialist friends” .
The academic paper “Development for Whom?” uses stronger language, arguing that India’s development model is characterized by “institutionalized crony capitalism” where “public resources in India increasingly translate into private gains for a privileged minority” .
Whether one accepts this characterization or not, the data on billionaire wealth growth—a 400% increase for the top five families in just six years—requires explanation. The normal functioning of market economies does not typically produce such concentrated gains in such a short period without some form of preferential access or policy capture.
Regressive Taxation
The Indian tax system, critics argue, is regressive in its effects. The Wire analysis notes that though direct income tax and indirect taxes such as GST contribute significant shares of revenue, “they are rather regressive in nature as they do not take into account consumption of the households” .
Wealth taxes—direct taxes on accumulated assets—have been largely absent from India’s tax architecture. Capital gains taxes, which apply to investment income, are lower than marginal income tax rates, favoring those whose income derives from assets over those whose income derives from labor.
Privatization and Asset Transfer
The privatization of public sector undertakings, while presented as efficiency-enhancing, also transfers wealth from the state (i.e., the public) to private shareholders. The academic paper argues that India’s “privatization-heavy development model” has resulted in “public resources… increasingly translate into private gains for a privileged minority” .
SECTION 4: SOCIAL CONSEQUENCES OF RISING INEQUALITY
The concentration of wealth is not merely an economic statistic. It has profound social consequences that affect the fabric of Indian society.
Erosion of Social Safety Nets
As wealth concentrates at the top, the fiscal capacity to provide social protection for the bottom is constrained. The Budget 2026’s reduction in subsidy allocation—a 28 percent decrease from its previous peak—comes at a time when food inflation remains high and real incomes for low-income households have stagnated .
The Congress party has flagged issues in MGNREGA, the flagship employment guarantee scheme, saying that workers are now facing “wage crises and delays in payment, weakening the safety net that previously supported millions” . Investment in education and health, the primary pathways out of poverty, is “steadily declining” .
The Distress-Driven Nature of Female Labor Force Participation
The Economic Survey’s celebration of rising female labor force participation masks a darker reality. The Wire analysis notes that “much of the recent increase in FLPR appears distress-driven, propelled by household income shocks, rising costs of living, and the erosion of employment security” .
Female labor participation in India remains stuck at 15.7 percent—”unchanged for a decade, reflecting social and structural constraints that limit women’s economic access” . The World Inequality Report notes that this figure shows “no improvement over the past decade” .
Rather than reflecting enhanced capabilities, skills, or labor market inclusion, women’s increased workforce participation often reflects household economic desperation. When family incomes are squeezed, women enter the workforce—often in low-paid, insecure, informal positions—to keep the household afloat.
MSME Sector Under Pressure
The Micro, Small, and Medium Enterprise (MSME) sector, often called the backbone of India’s economy and a critical source of employment for the middle and lower classes, is “under unprecedented pressure due to both domestic policies and foreign policy failures,” according to Congress leader Jairam Ramesh .
As large corporate houses have grown—the top five billionaire families’ wealth increased 400 percent—small businesses have struggled. The concentration of economic power at the top has been accompanied by the squeezing of the middle.
Rising Debt Burdens
“Inflation has risen so high that even employed people are increasingly burdened with debt instead of savings,” the Congress party has alleged . The combination of stagnant wages and rising living costs has pushed many middle-class and lower-middle-class households into debt, further widening the gap between those who own assets and those who owe.
SECTION 5: DEMOCRATIC CONSEQUENCES — INEQUALITY AS A THREAT TO DEMOCRACY
The most alarming warning about rising wealth inequality is not about economics—it is about democracy.
The Nexus Between Economic and Political Power
Congress leader Jairam Ramesh warned that “extreme concentration of wealth is not just a problem for the economy, but a direct attack on the very soul of democracy. When economic power is concentrated in a handful of hands, political decisions also begin to favour them” .
This warning is not merely rhetorical. The academic paper “Development for Whom?” argues that India’s development model is characterized by “elite capture”—a situation where public policy is shaped by and for a small elite, rather than for the broader population .
The mechanisms of elite capture include campaign finance (wealthy individuals and corporations fund political parties), lobbying (corporate houses employ former bureaucrats and politicians to influence policy), media ownership (a handful of billionaires control much of India’s media landscape), and the revolving door between government and corporate positions.
Global Precedents
Ramesh drew comparisons to global trends, noting that “similar trends abroad—where extreme inequality and weakened democratic institutions coexist—have triggered political anarchy” .
This observation echoes the work of economists like Thomas Piketty (one of the editors of the World Inequality Report), who has argued that extreme inequality destabilizes democratic institutions by undermining the perception that the political system serves all citizens equally. When citizens believe the system is rigged in favor of the wealthy, democratic legitimacy erodes.
Exclusion from Democratic Processes
Ramesh concluded that “this trend is gradually excluding millions of citizens from the democratic and developmental processes” . This exclusion can take many forms: low political participation by poor and marginalized communities; a sense that voting does not matter because policies will favor the rich regardless; and the growing gap between the social backgrounds of political representatives and the citizens they represent.
The academic paper argues that “India must reorient its priorities toward a people-centered model if it wishes to transform economic growth into broad-based social progress” .
SECTION 6: THE GENDER DIMENSION OF INEQUALITY
The World Inequality Report 2026 highlights a specific dimension of India’s inequality that is often overlooked: gender.
Stagnant Female Labor Force Participation
Female labor force participation in India remains at 15.7 percent—”unchanged for a decade” . This figure means that fewer than one in six working-age women are employed or seeking employment. For comparison, male labor force participation is around 75 percent.
This “shows no improvement over the past decade,” the report notes . Despite economic growth, women have not entered the workforce at higher rates. This represents both a massive waste of human potential and a source of continued economic vulnerability for women.
Distress-Driven Participation
The Wire analysis argues that even the modest increase in reported FLPR in recent years is “distress-driven, propelled by household income shocks, rising costs of living, and the erosion of employment security” .
When a household’s male breadwinner loses income—due to unemployment, wage stagnation, or health crisis—women enter the workforce, often in low-paid, insecure, informal positions. This is not empowerment; it is survival.
Budget 2026’s Gender Provisions: Insufficient
The Budget 2026 proposed “establishing girls’ hostels in every district, particularly aimed at improving access to education and STEM fields.” It also reportedly includes “credit support for women entrepreneurs through initiatives such as SHE (Self-Help Entrepreneur) marts” .
However, the Wire analysis argues that “these proposals are strikingly thin on institutional details, where there is little clarity on the mechanisms of credit delivery, and eligibility criteria.” More fundamentally, “an over-reliance on credit-based strategies to promote women’s entrepreneurship, particularly in rural and poor households rests on a flawed assumption that access to credit alone can overcome structural constraints” .
Without addressing “barriers such as asset ownership, market access, care burdens, and social norms, credit tends to become a source of financial vulnerability rather than empowerment” .
SECTION 7: THE POLITICAL DIVIDE — OPPOSITION ACCUSATIONS AND GOVERNMENT DEFENSE
The issue of rising inequality has become a major political battleground.
The Congress Position
The Congress party has made wealth concentration a central theme of its opposition to the Modi government. Jairam Ramesh has repeatedly accused the government of driving “an unprecedented concentration of wealth” and warned that this “threatens not only the economy but the very soul of democracy” .
Citing the Hurun India Rich List 2025, Ramesh claimed that “just 1,687 people now own half of India’s wealth” . He alleged that the MSME sector is under pressure, social welfare schemes like MGNREGA are struggling, and “earning opportunities for ordinary people are shrinking” .
Ramesh warned that “when economic power is concentrated in a handful of hands, political decisions also begin to favour them,” creating “a growing social and economic inequality” that leads to “millions of citizens gradually being excluded from the process of democracy and development” .
The Government’s Silence
The government has not offered a detailed defense of its record on inequality. The Budget 2026’s focus on capital expenditure over redistributive welfare suggests that the government’s priority is growth acceleration, not redistribution .
Government defenders would likely argue that economic growth is the only sustainable path out of poverty; that redistribution without growth leads to stagnation; and that India’s growth has lifted millions out of absolute poverty even if relative inequality has worsened. They might also point to targeted welfare schemes—free foodgrains, housing subsidies, cooking gas subsidies—as evidence of commitment to the poor.
However, critics argue that these schemes are insufficient to offset the scale of wealth concentration and the erosion of social safety nets documented in the World Inequality Report.
SECTION 8: THE PARADOX OF UPPER MIDDLE-INCOME STATUS
Amid all this talk of inequality, there is another story: India is getting richer in absolute terms.
India’s Income Trajectory
SBI Research projects that India will become an upper middle-income country by 2030, with per capita GNI reaching approximately 4,276—closetotheWorldBank′suppermiddle−incomethresholdof4,495 .
India reached a per capita income of 1,000in2009and2,000 in 2019. It is expected to reach 3,000in2026and4,000 by 2030 . In nominal GDP terms, India has moved from the 14th largest economy in 1990 to 4th in 2025 and is likely to reach $5 trillion by 2027-28 .
By 2028, India is projected to become the world’s third-largest economy .
The Inequality Paradox
These numbers sit uncomfortably alongside the World Inequality Report’s findings. How can a country be on track to become an upper middle-income economy while the bottom 50 percent’s share of national income remains stuck at 15 percent?
The answer lies in the difference between averages and distributions. The average Indian’s income is rising—but because the gains at the top are so large, the average rises even while most Indians see little improvement. The top pulls the average up, but the middle and bottom see only small absolute gains.
The World Inequality Report’s century-long income share chart shows “a relentless rise of the top 10 percent since the 1980s, climbing back to near-historic highs, while the bottom 50 percent trace a nearly flat line—a visual reminder of missed opportunities for millions” .
What Upper Middle-Income Status Means for Inequality
The transition to upper middle-income status does not automatically bring greater equality. In fact, many countries have experienced rising inequality during their middle-income transitions. The critical question is whether India’s growth model will shift from capital-intensive to labor-intensive, creating formal sector jobs that can absorb the millions of young Indians entering the workforce each year.
The academic paper “Development for Whom?” argues that India must learn from China’s manufacturing-oriented strategy, which successfully absorbed labor and reduced poverty, rather than continuing with a “privatization-heavy development model” that benefits a narrow elite .
SECTION 9: RECOMMENDATIONS — TOWARD INCLUSIVE GROWTH
The World Inequality Report 2026 and other analyses offer recommendations for addressing India’s inequality crisis.
Stronger Social Protection
Experts warn that “if India wants inclusive growth, it must urgently push for better-quality jobs, stronger social protection, and policies that allow wealth and opportunities to flow beyond a small elite” .
The academic paper argues that India needs “strengthened welfare systems, industrial revitalization, robust public investment, and policy transparency—to ensure that development becomes inclusive and equitable” .
Progressive Taxation
The Wire analysis argues for “progressive redistributive policy” and “progressive taxation to fund public goods” . Currently, India’s tax system is “regressive in nature as they do not take into account consumption of the households” .
Potential reforms include a wealth tax on large fortunes; higher capital gains taxes on investment income; estate or inheritance taxes; and more progressive income tax slabs.
Labor-Intensive Manufacturing
The academic paper contrasts India’s capital-intensive growth with China’s labor-intensive manufacturing strategy, which successfully absorbed labor and reduced poverty. India needs to prioritize sectors that create large numbers of formal jobs, rather than sectors that maximize GDP growth per unit of investment .
Investment in Human Capital
Public investment in health and education has been “steadily declining,” according to Congress allegations . Reversing this decline is essential for providing the bottom 50 percent with the skills needed to access better-paying jobs.
Gender-Inclusive Policies
The Wire analysis argues that addressing women’s economic marginalization requires more than credit-based entrepreneurship schemes. It requires “addressing barriers such as asset ownership, market access, care burdens, and social norms” .
Public investment in childcare, maternity benefits, and workplace safety could enable more women to participate in formal employment.
SECTION 10: THE CENTRAL QUESTION — GROWTH FOR WHOM?
The politics of rising wealth inequality in India reflects a fundamental tension between two competing visions of development.
The Growth-First Vision
From one perspective, India’s growth trajectory is a success story. Millions have been lifted out of absolute poverty. The economy has weathered global shocks. Infrastructure is being built at an unprecedented scale. India is on track to become the world’s third-largest economy and an upper middle-income country by 2030.
Inequality, from this perspective, is an unfortunate byproduct of growth that will eventually be addressed through trickle-down effects. The priority must remain accelerating growth, not redistributing existing wealth.
The Redistribution Vision
From another perspective, growth that does not reach the bottom 50 percent is not genuine development. The World Inequality Report’s data shows that the bottom 50 percent’s share of national income has not budged in a decade—meaning that even as the economy grew, the poorest half of the population saw no relative improvement.
Inequality is not merely a byproduct; it is a barrier to future growth. Extreme concentration of wealth distorts markets, undermines democracy, and erodes social cohesion. The priority must be redistributive policies that ensure the benefits of growth reach those who need them most.
The Unanswered Question
The central question of this topic remains unresolved: Can India achieve inclusive growth without addressing the structural drivers of wealth concentration?
The World Inequality Report’s foreword, written by Jayati Ghosh and Joseph Stiglitz, frames the challenge: “India’s economic rise may make global headlines, but a new set of numbers reveals a stark reality beneath the surface: a tiny slice of Indians is racing ahead, while half the country is stuck at the bottom with little to no movement” .
The data sends a powerful message: “India is growing, but too many Indians are not” .
Whether India can reorient its development model to ensure that growth translates into broad-based social progress remains the defining question for the country’s economic future. As the academic paper concludes, India must “transform economic growth into broad-based social progress” if it wishes to avoid the political and social instability that extreme inequality has produced in other nations .
SUMMARY TABLE: KEY INEQUALITY INDICATORS
| Indicator | Value | Source |
|---|---|---|
| Top 10% share of national income | 58% | World Inequality Report 2026 |
| Bottom 50% share of national income | 15% | World Inequality Report 2026 |
| Top 1% share of total wealth | 40% | World Inequality Report 2026 |
| Top 10% share of total wealth | 65% | World Inequality Report 2026 |
| Bottom 50% share of total wealth | 6% | World Inequality Report 2026 |
| Top 1% income (average annual, PPP) | €140,649 | World Inequality Report 2026 |
| Bottom 50% income (average annual, PPP) | €940 | World Inequality Report 2026 |
| Average income per capita (PPP) | €6,200 | World Inequality Report 2026 |
| Average wealth per capita (PPP) | €28,000 | World Inequality Report 2026 |
| Top 1% wealth share increase (2019-2022) | 36.5% → 40.1% | Wealth Tracker India 2026 |
| Top 5 billionaire families wealth growth (2019-2025) | 400% | Wealth Tracker India 2026 |
| Female labor force participation rate | 15.7% | World Inequality Report 2026 |
| Number of ultra-rich individuals (wealth > ₹1,000 cr) | 1,687 | Hurun India Rich List 2025 |
| Combined wealth of top 1,687 individuals | ₹167 lakh crore (~50% of GDP) | Hurun India Rich List 2025 |