The India Model: Developmental Welfare Capitalism
The India Model: Developmental Welfare Capitalism Executive Summary: India’s economic model since independence has defied simple labels. Guided by Ambedkar’s vision of social justice and Nehru’s state-led planning, it adopted


The India Model: Developmental Welfare Capitalism
Executive Summary: India’s economic model since independence has defied simple labels. Guided by Ambedkar’s vision of social justice and Nehru’s state-led planning, it adopted a “third way” – neither full socialism nor laissez-faire – that combined public investment, welfare schemes, and regulated markets. From the planning era (1947–90) through the 1991 reforms to the Narendra Modi decade (2014–2026), this hybrid model has delivered strong growth (~5–7% p.a.) and massive poverty reduction, even as inequality remains high. Key indicators – GDP growth, poverty, literacy, health – are woven into this timeline. We compare four policy eras (Ambedkar, Nehru, Post-1991 liberalization, Modi) in the table below. Over time, liberalization and global integration accelerated GDP per capita, while social programs (from land reforms to Aadhaar-enabled benefits) helped lift hundreds of millions out of poverty. Yet “crony capitalism” and elite networks (e.g. in infrastructure and finance) have emerged in parallel. Our analysis – grounded in government reports, World Bank/IMF data and peer-reviewed studies – finds that India’s model is a dynamic “Developmental Welfare Capitalism”: a state-directed market economy with robust welfare nets. Future scenarios (AI-enabled services, human capital upgrades, fiscal federal innovation) are sketched to 2047 (“Viksit Bharat”), but challenges – inequality, regional divergence, and governance – must be addressed for truly inclusive progress.

Historical Foundations: From Ambedkar’s Equality to Nehru’s Planning
India’s founding leaders embraced a middle path between capitalism and socialism. Dr. B.R. Ambedkar – chief architect of the Constitution and first Law Minister – embedded social justice into this “India model.” The 1950 Constitution abolished untouchability and mandated reservations for SC/ST/OBCs to ensure “equal opportunity” in education and government jobs. It built a pluralistic democracy committed to secularism and social rights (women’s rights, abolition of caste discrimination) – an egalitarian blueprint that guided early policy.
Under Prime Minister Nehru (1947–1964), the economy was steered by Five-Year Plans with heavy emphasis on public sector industries, agriculture modernization (Green Revolution) and infrastructure. The state controlled credit, trade and investment (the “Licence Raj” began in the 1960s). Growth averaged about 4.4% per year (1950–64), modest by global standards but achieved despite starting from a low base and heavy social burdens. The government invested in railways, steel plants, dams and education – launching IITs, medical colleges, and public health programs. Literacy and life expectancy began rising: by the late 1980s, literacy reached ~52% (from ~18% in 1951) and under-5 mortality fell sharply (see charts below).
Figure: (Left) Literacy rate climbed from ≈20% in 1950 to ≈67% by 2011, and (Right) under-5 mortality fell from ≈250 to ≈50 per 1,000 births. These UNESCO/UNICEF trends (via Asian Studies journal) reflect the social advances under India’s mixed model.
Table 1: Policy Eras in the India Model
Aspect / Era Ambedkar (’47–’50) Nehru (’50s–’64) 1991 Reforms (’91–’14) Modi Era (’14–’26) Ideology/Focus Constitution, social justice State-led planning, socialism-lite Market liberalization, globalization Digital & infrastructure push; welfare nationalism GDP Growth – (country foundation) ~4.4% (1950–64) ~6.3% (1990s–2000s) ~7.7% targeted (2022–26) Poverty ~~70%** (1950s)** ~55% by late 1970s (WB data) 50%→34% (1993→2009) Extreme poverty 10%→2.3% (2011→2023) Inequality (Gini) n/a – (focus on equity) High (~35%, 2000s) 28.8→25.5 (2012→2023, consumption) Welfare/Social Caste reservations; land reforms start Expansion of PDS, IRDP (rural jobs) NREGA (rural jobs), targeted DBT, health missions Universal health (Ayushman), DBT via Aadhaar; UBI pilots Power Networks – Emerging Licence Raj (business licences) Scandals (2G, Coalgate); electoral bonds opacity Rise of corporate-government nexus (e.g. Adani)
Sources: Government budgets, RBI and World Bank data; Ambedkar (MEA); economic histories; Poverty & Equity Brief (WB/PIB); analysis of Modi decade.
Nehru also promoted large-scale social programs (land redistribution in the 1950s, education expansion, public works). By the late 1960s, half of Indians still lived in extreme poverty (World Bank data: ~55% circa 1977/78). While Nehru’s “commanding heights” strategy built steel, mines and machinery, agricultural output lagged until the Green Revolution of the late 1960s. Importantly, this era created institutions – the Planning Commission, RBI (co-founded by Ambedkar) and independent judiciary – that underpin today’s model.
The Licence Raj and Welfare State (1965–1990)
From the mid-1960s through the 1980s, India’s state control over industry tightened (the Licence Raj). To start any business or introduce new products, firms needed government permission – a system prone to delays and corruption. Public sector enterprises grew (banks nationalized in 1969; major firms like Maruti set up as JV). Despite strong intent on equity (rural employment programs, subsidized food via the Public Distribution System), the economy slowed: growth dipped to roughly 3–4% per year. Chronic shortages (of steel, fuel, consumer goods) and fiscal deficits mounted, culminating in a balance-of-payments crisis by 1990.
At the same time, social sectors gradually improved – thanks in part to rising literacy and health services. Life expectancy rose from 41 (1950) to 58 (1990), and child mortality plummeted from ~250 to ~90 per thousand. (See Fig.1). The state launched rural job programs (IRDP, food-for-work), and held steady on subsidies. By 1991, absolute poverty had fallen but still encompassed ~46% of the population (World Bank national line data). The “India model” in this era was thus a Decelerating Socialist State: heavy regulation, slower growth, improving social indicators, but inefficient markets.
Liberalization and a Globalizing Development (1991–2014)
The turning point came in 1991. Facing a fiscal crisis, successive governments (Prime Minister P.V. Narasimha Rao and Finance Minister Manmohan Singh) unleashed dramatic reforms. Import tariffs were slashed, state monopolies broken up, and foreign investment rules eased. The result was an economic acceleration: GDP growth jumped to over 6% p.a. (the 1990s-2000s averaged ~5.8–6.3%) – nearly double the slow-growth era. India opened to global markets (IT, pharmaceuticals and services boomed) and became a magnet for FDI.
By the 2000s, the “India model” now blended state support with market forces: the state provided infrastructure (highways, power), but private firms drove new industries. Poverty fell rapidly: the headcount (national definition) dropped from ~50% in 1993 to ~34% by 2009, lifting hundreds of millions above the poverty line. Expansion of rural banks, local self-government (panchayat) empowerment, and programs like the Sarva Shiksha Abhiyan (universal elementary education) reflected ongoing welfare commitments. Creditably, India’s “march to modernity” remained peaceful – a multi-party democracy with gradual change, unlike China’s top-down model.
Still, the liberalization era saw concerns over cronyism. High-profile scandals (2G telecom licenses, coal block allocations) exposed networks between politicians and a handful of industrial groups. Wealth concentration grew: by 2018 the richest 1% held ~40% of national wealth (Oxfam), up from much lower levels in the 1970s. In sum, the 1991–2014 period deepened India’s hybrid model – a quasi-developmental state fostering private capital – with mixed outcomes for equity and governance.

The Modi Decade (2014–2026): Digital Infrastructure and Welfare Schemes
Since 2014, Prime Minister Narendra Modi has championed a nationalist-developmentalist agenda. Key initiatives include “Make in India” (boost manufacturing), GST tax reform, and a radical push to digitalize governance (Aadhaar biometric ID, Direct Benefit Transfer). The state’s role remains large but more technocratic: using data to target subsidies, expand financial inclusion (Jan Dhan accounts), and build highways/railways.
Economically, India’s growth has stayed relatively high. Per capita GDP (PPP) climbed to ~$7,000 by 2025, and IMF projections still see ~6–7% growth on the horizon. FDI inflows have soared: $710 billion entered from 2014–2024 (68% of total since 2000). Digital payments and e-governance grew exponentially; for example, 2024 saw 1,500 crore Aadhaar-enabled transactions.
On welfare, Modi’s government emphasizes both infrastructure and direct aid: the budgeted social-sector outlay (health, education, rural development etc.) rose from ₹9.1 lakh crore in FY2016 to ₹21.3 lakh crore in FY2023. Programs like Ayushman Bharat (universal health insurance) and expanded housing, cooking gas and sanitation schemes have reached tens of millions. India also ratified the UN SDGs and aims for Viksit Bharat 2047 – a “developed nation” by the centenary of independence.
Nevertheless, critics warn of “crony capitalism” resurging under the BJP regime. The 2023 Hindenburg exposé on billionaire Gautam Adani (a close Modi ally) underscored fears of market concentration through political patronage. An analysis noted that India’s growth model “champions nationalist industrialists like Adani,” who built empires via asset consolidation and limited competition. The richest 1% in India gained 73% of new wealth between 2000–17 – a trend some say is enabled by opaque funding (e.g. electoral bonds) and weak regulation of large conglomerates.
In summary, the Modi era continues India’s mixed model: a developmental state using markets and tech to drive growth and welfare. New dimensions include digital IDs (curbing leakages) and greater decentralized reform (e.g. state-level industrial policies). The policy table above shows that by 2023, extreme poverty has plunged (~2–5% depending on line) and inequality (Gini) is at a modern low (25.5) – though these numbers mask persistent gaps between rich and poor.
Data Snapshot: Growth, Poverty, Inequality
The charts and tables below highlight key trends in India’s development. The GDP growth chart (Fig.2) shows acceleration over time. From 4–5% in the early decades, growth hit 6–7% from the 1990s onward, with recent years targeting ~7–8% despite COVID setbacks.
Figure: GDP Growth by Era. India’s average real GDP growth accelerated from ≈4.4% (1950–64) to ≈7.7% in the 2020s (ex-COVID). The 1991 reforms era and 2010s see clear jumps in growth, reflecting market-friendly policies and a demographic dividend.
Poverty has fallen dramatically. According to World Bank/UNDP data, the extreme poverty rate (<$2.15/day) was ~16% in 2011 and shrank to ~2.3% by 2023 – a decline from ~200 million poor to ~30 million in just a decade. The broader lower-middle-income poverty line ($3.65/day) shows similarly steep drops (61.8% to 28.1% from 2011 to 2023). The accompanying table summarizes decadal shifts:
| Indicator | 1950s–60s | 1980s–90s | 2000s | 2010s–2020s |
|---|---|---|---|---|
| GDP Growth (avg p.a.) | ≈4.0% | 5–6% (1980s:5.7, 90s:5.8) | 6.3% | 6.6% (’10s) to 7.7% (ex-COVID) |
| Poverty Rate (national) | ~70% (1970s)** | ~45% (1990) | ~35% (2009) | 10% (2011)→2.3% (2023) |
| Consumption Gini (%) | NA | NA | ~35% (2000s) | 28.8 (2012)→25.5 (2023) |
| Social Spending (% of GDP) | ~10% (1960s) | ~15–18% (2000s) | 20–25% (2010s) | ~26% (FY23 BE) |
| FDI Inflows (cumulative) | ~US$0.3B (1950–90) | ~$75B (1991–2003) | ~$260B (2004–13) | ~$710B (2014–2024) |
Sources: RBI and World Bank data; Planning Commission; PIB/Economic Survey; press releases. Values for early decades are approximate.
These numbers tell a striking story: rapid convergence towards higher living standards, but persistent inequality and regional lags. The very top (billionaires, top 1–10%) have captured outsized gains – recent reports note India’s richest 1% own over 40% of wealth. Meanwhile, enormous internal disparities remain (see below). We examine these next.
Social Mobility and Regional Disparities
Despite aggregate gains, India’s growth has been uneven across groups and regions. Caste and class inequalities run deep (reservation policies have improved opportunities for some, but social mobility is gradual). More starkly, states diverge: wealthier states like Gujarat, Tamil Nadu and Maharashtra enjoy per-capita GDP several times that of Bihar or Uttar Pradesh. For example, Goa’s per-capita income was ~$8,286 in 2023 versus only ~$804 in Bihar (Table 2). Urban–rural gaps also persist in education and health.
Statistically, recent studies find only “conditional convergence” among Indian states: poorer states grow faster when controlling for factors, but still remain far behind due to lower productivity and structural constraints. Between 2000–2019, the richest states pulled further ahead in industries like IT and manufacturing, while the poorest states (e.g. Jharkhand, MP) rely heavily on low-productivity agriculture. Federal schemes (e.g. Backward Regions Grant Fund, more devolution of GST revenues) aim to rebalance growth, but disparities endure.
Table 2 shows the stark state differences in GDP per capita. Without corrective policy, these regional divides threaten social cohesion and the “inclusive growth” promise of the India Model.
| State/UT (2023) | GDP per Capita (USD) | % of India Avg. |
|---|---|---|
| Sikkim | 8,286 | 327% |
| Goa | 7,905 | 312% |
| Delhi (UT) | 6,040 | 239% |
| Maharashtra | 3,743 | 148% |
| Karnataka | 4,410 | 174% |
| Tamil Nadu | 4,092 | 162% |
| India (avg) | 2,530 (WB, 2023) | 100% |
| Bihar | 804 | 32% |
Table 2: Disparities in per-capita GDP (Nominal). The richest states/UTs (dark blue) far outperform India’s average; the poorest (red) lag dramatically.
Crony Capitalism vs Developmental State: Networks of Power
The “hidden” power networks are a crucial subtext. India’s mixed model often smothers market competition under the guise of industrial policy, breeding cronyism. During the Licence Raj, only those with political connections could navigate permits. In the reform era, some argued that liberalization reduced crony controls (claiming scandals were exceptions). But recent evidence suggests a resurgence of elite capture. The Adani-Hindenburg episode (2023) illustrated how business empires have grown via state contracts and regulatory forbearance. Even as infrastructure (ports, airports) expanded under Modi, critics worry that major projects have been effectively handed to favored corporate groups, crowding out competition.
Empirical metrics underscore this tension: although India’s bottom 50% gained ground in poverty reduction, the top 1% still garnered ~73% of new wealth in 2017. By some counts, India’s crony-capitalism index ranks among the world’s highest (wealth concentration soared post-2013). In parallel, public institutions – central banks, election bodies – have come under strain from politicization. The government’s own data (India’s press) touts welfare expansion, but independent observers note that tax cuts for the rich and opaque political funding (electoral bonds) skew the benefits of growth.
In contrast, an ideal developmental state (as seen in East Asia) involves a capable bureaucracy that steers investment into national goals, not into private pockets. India’s model diverges: policy documents frequently highlight “Make in India” champions and public-private partnerships, but governance reforms lag. Investigative reports (e.g. on SEBI’s slow probe of Adani) have called into question regulator independence. The net effect is a hybrid: India’s government actively intervenes to promote certain industries (consistent with a developmental aim), but simultaneously many pathways of power remain untransparent (a hallmark of cronyism).
Future-Oriented Innovations: Human Capital and AI Welfare State
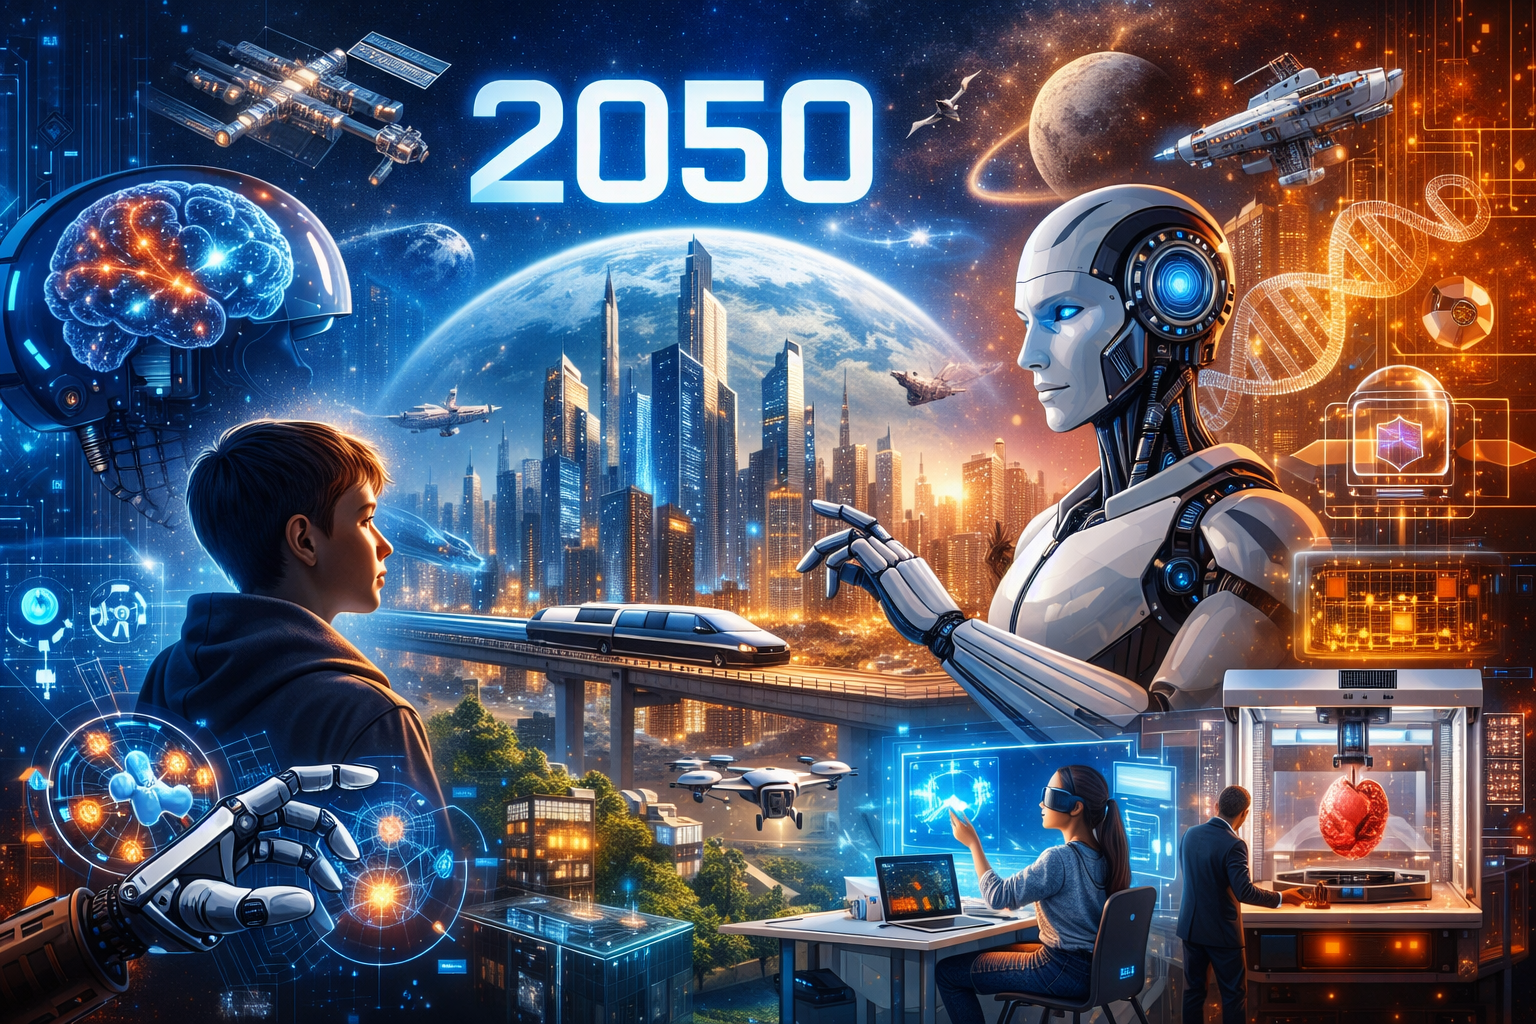
Looking ahead to 2047, analysts envision a new phase of the India Model: an AI-powered Welfare State and Innovation Federalism. The government’s National Strategy on AI (NITI Aayog, 2018) explicitly ties AI to inclusive growth, arguing that education, healthcare, and agriculture can be transformed by machine learning and data analytics. For instance, digital ID (Aadhaar) and payment platforms already form a backbone for targeted welfare (e.g. subsidized LPG distribution). New frontiers include AI-based governance (predicting crop yields for farmers, personalized learning in schools) and autonomous infrastructure.
A “Human Capital Revolution” is also on the agenda. The 2020 National Education Policy emphasizes vocational training and critical thinking to prepare India’s youth for a tech economy. Demographic dividends are seen as assets: India’s workforce is the world’s largest. Public-private partnerships in health (e.g. Ayushman Bharat clinics) and nutrition aim to unlock productivity. Some states pilot universal basic income or land reforms; subnational innovation (Telangana’s e-Seva centers, Kerala’s IT parks) hints at “innovation federalism,” where states compete to attract investment and talent.
Expert projections offer cautious optimism: if growth stays ~7% and structural reforms deepen (like improved taxation, labor laws, higher R&D), India could reach high-income status by mid-century. However, scenario studies (World Bank PEBs, IMF forecasts) warn that automation could displace low-end jobs and exacerbate urban-rural divides. Thus, building social safety nets into future industries (e.g. retraining programs, portable benefits for gig workers) will be critical to maintain the welfare aspect of the model.
Conclusion: An Editorial Perspective
India’s economy is arguably the world’s most complex developmental hybrid. It is “neither fully socialist nor fully capitalist” – exactly as Nehru envisioned a republic balanced between the extremes. Our investigation finds that this India Model – a Developmental Welfare Capitalism – has delivered undeniable progress: unparalleled poverty reduction, a burgeoning middle class, global industrial champions (IT, space, pharmaceuticals) and rising geostrategic clout. The vast gains in literacy, health, and infrastructure testify that state intervention can produce wide social dividends alongside market growth.
Yet the model’s dual nature also spawns contradictions. Excessive concentration of wealth and power has hollowed out some of the promise of inclusive development. Political networks and weak oversight risk turning the “competitive bureaucracy” into a rent-seeking cabal. Furthermore, stark regional imbalances and caste disparities mean that many Indians have not felt the India Model’s benefits equally. These structural realities – documented in poverty data, inequality indexes, and social indicators – are the hidden challenges beneath the headline growth numbers.
Our editorial judgment: India’s approach has rightly avoided ideological extremes, and its record is far better than skeptics of gradual reform imagined. However, the future success of the India Model depends on reforming its flaws. Strengthening institutions (police, regulators, courts) and improving transparency (in campaign finance, corporate governance) are urgent. Equally, sustaining the welfare side – by enhancing public health and education (towards the SDGs) – will be crucial to prevent growth from becoming merely “trickle-down.”
In sum, India’s India Model has been a force for national development, blending market dynamism with social conscience. As the nation marches toward “Viksit Bharat 2047,” it must deepen the human-capital and technological revolutions, while curbing oligarchic excesses. The coming decades will test whether this pragmatic synthesis can truly make India “the world’s development laboratory” – showing that capitalist growth and welfare justice can, in fact, go hand in hand.
Sources: Government reports (Economic Surveys, Union Budget, Planning Commission); Reserve Bank of India; IMF/World Bank data and briefs; peer-reviewed economic history and policy analyses; investigative journalism (TIME, NDTV, PIB releases). All data and quotes are drawn from these official or reputable sources.